At HodlBot, we don’t make bets on individual coins. The cryptocurrency market is irrational and fundamental cryptocurrency valuations are not well understood.
Coins fall in and out of favour in a way that is hard to predict. Take XRP as an example. Despite not being a truly decentralized cryptocurrency, it shot past ETH for the #2 spot earlier this week.
While we don’t have an opinion on how the market prices individual coins, we are confident that the price and value of cryptocurrencies will increase in the long run. We’re firm believers in the underlying technology.
I know that the asset class will grow, but I don’t know who the winners will be.
This is why we’re building cryptocurrency indices.
In my opinion, most investors don’t benefit from taking on unsystematic risk. If you’re confident about the crypto market, then it is wiser to bet your money on the entire cryptocurrency market rather than test your luck picking individual coins.
The performance of “the market” is the capitalization-weighted average of the performance of all the investors in the market. Therefore, if some traders outperform, the others must underperform.
Most active traders don’t realize how difficult it is to consistently beat the market. Over the last 15-year period, 95% of active funds failed to beat index funds.
It becomes even harder to beat the market after we take into account all the time spent doing research(opportunity cost), transaction costs incurred while trading, and traders who are kicking your ass by breaking the rules.
Constructing a Total Market Index
The ideal index consists of every single coin in the market, weighted by market cap. Unfortunately, creating such a portfolio is infeasible because of minimum trading amounts and trading fees. The only option left is to take a sample.
In principle, the larger the sample, the more accurate it will be in tracking the overall market. But as the sample grows larger, the more difficult and costly it is to maintain.
Most indices take the top N coins by market capitalization because the top coins capture a higher % of the total market cap.
But if we simply weighted the top 20 coins by market cap, we would end up with a portfolio that is extremely top-heavy. The index wouldn’t do a great job at capturing the risk & performance of the lower-capped coins.
Bitcoin makes up almost 60% of the entire portfolio, while ranks 15–20 make up only 3.4% of the portfolio.
The HODL20 Index
The HODL20 was our first attempt to index the market. We made it available to all investors, without any account minimums or % management fees.
For the HODL20, we took the top 20 coins and assigned each coin a % allocation based on their weighted market capitalization.
Then we capped every coin to be at most 10% of the total portfolio value. Anything above 10% gets redistributed to all the coins below 10% until the entire sum of the portfolio adds up to 100%.
HODL 20 Allocation as of March 25, 2018. Head over to HodlBot to get started for free.
The HODL 20 makes up ~87% of the cryptocurrency market. For comparison, the S&P 500 represents ~75% of the US stock market.
Over a 3 year period, Bitcoin was up by a factor of 42x. HODL20 with no rebalancing was up a factor of 51x and the HODL20 with monthly rebalancing was up a factor of 164x.
A rebalance every 4 weeks incurred 0.26% in annual transaction costs.
Downsides with Caps
While caps are commonly used across traditional equity indices, it is not the only method to weigh lower-capped coins higher.
Placing a 10% cap on each coin, often maxed out each of the 5 highest ranking coins. To me, this didn’t always make sense.
For example, BTC’s market cap is ~20x higher than the 5th highest ranking coin. To equally weigh both in the HODL20 seems a bit suspicious.
Introducing the HODL30
The HODL30 is a 30 coin index that uses a different indexing methodology. The top 30 coins capture ~92% of the total market cap.
This index was inspired by our friends over at CCI30, whose work we greatly admire.
Smoothing Market Capitalizations
We noticed with the HODL20 that raw market capitalizations are quite volatile and can move back and forth a lot on a daily basis.
In order to smooth it, we’re going to take the exponentially weighted moving average.
where M(t) is the actual market cap at time t, M* is our adjusted market cap, i is the number of days away from the current date, and α is fixed constant.
To calculate the smoothed market cap for any particular day, we’re going to take the weighted sum of market caps going back into the past, where the weightings gets smaller and smaller the further back we go.
As i becomes larger, the weighting approaches 0.
Smoothed market capitalization for Bitcoin
As an example, we’re going to take the exponentially weighted moving average market cap for BTC.
As we decrease α, we get a smoother line. For our index, we’ve decided to take 0.3 for α.
Taking the Square Root of the Smoothed Market Capitalization
Once we have a smoothed market capitalization for each coin, we take the square root of each adjusted coin’s market cap.
This shifts some of the weightings from the highest capped coins towards the lower-capped coins. However, it still keeps a difference in weighting between differently ranked coins.
The HODL10
Since a 10% cap wouldn’t make any sense for a 10 coin portfolio, we’ve also decided to use the same methodology for the HODL10.
Users should use the HODL10 over the HODL30 if they have a much smaller portfolio, say <$200. Since there are minimum trading limits on Binance, a portfolio of $50–100 would not be suited for the HODL20 or HODL30.
Correlation Analysis
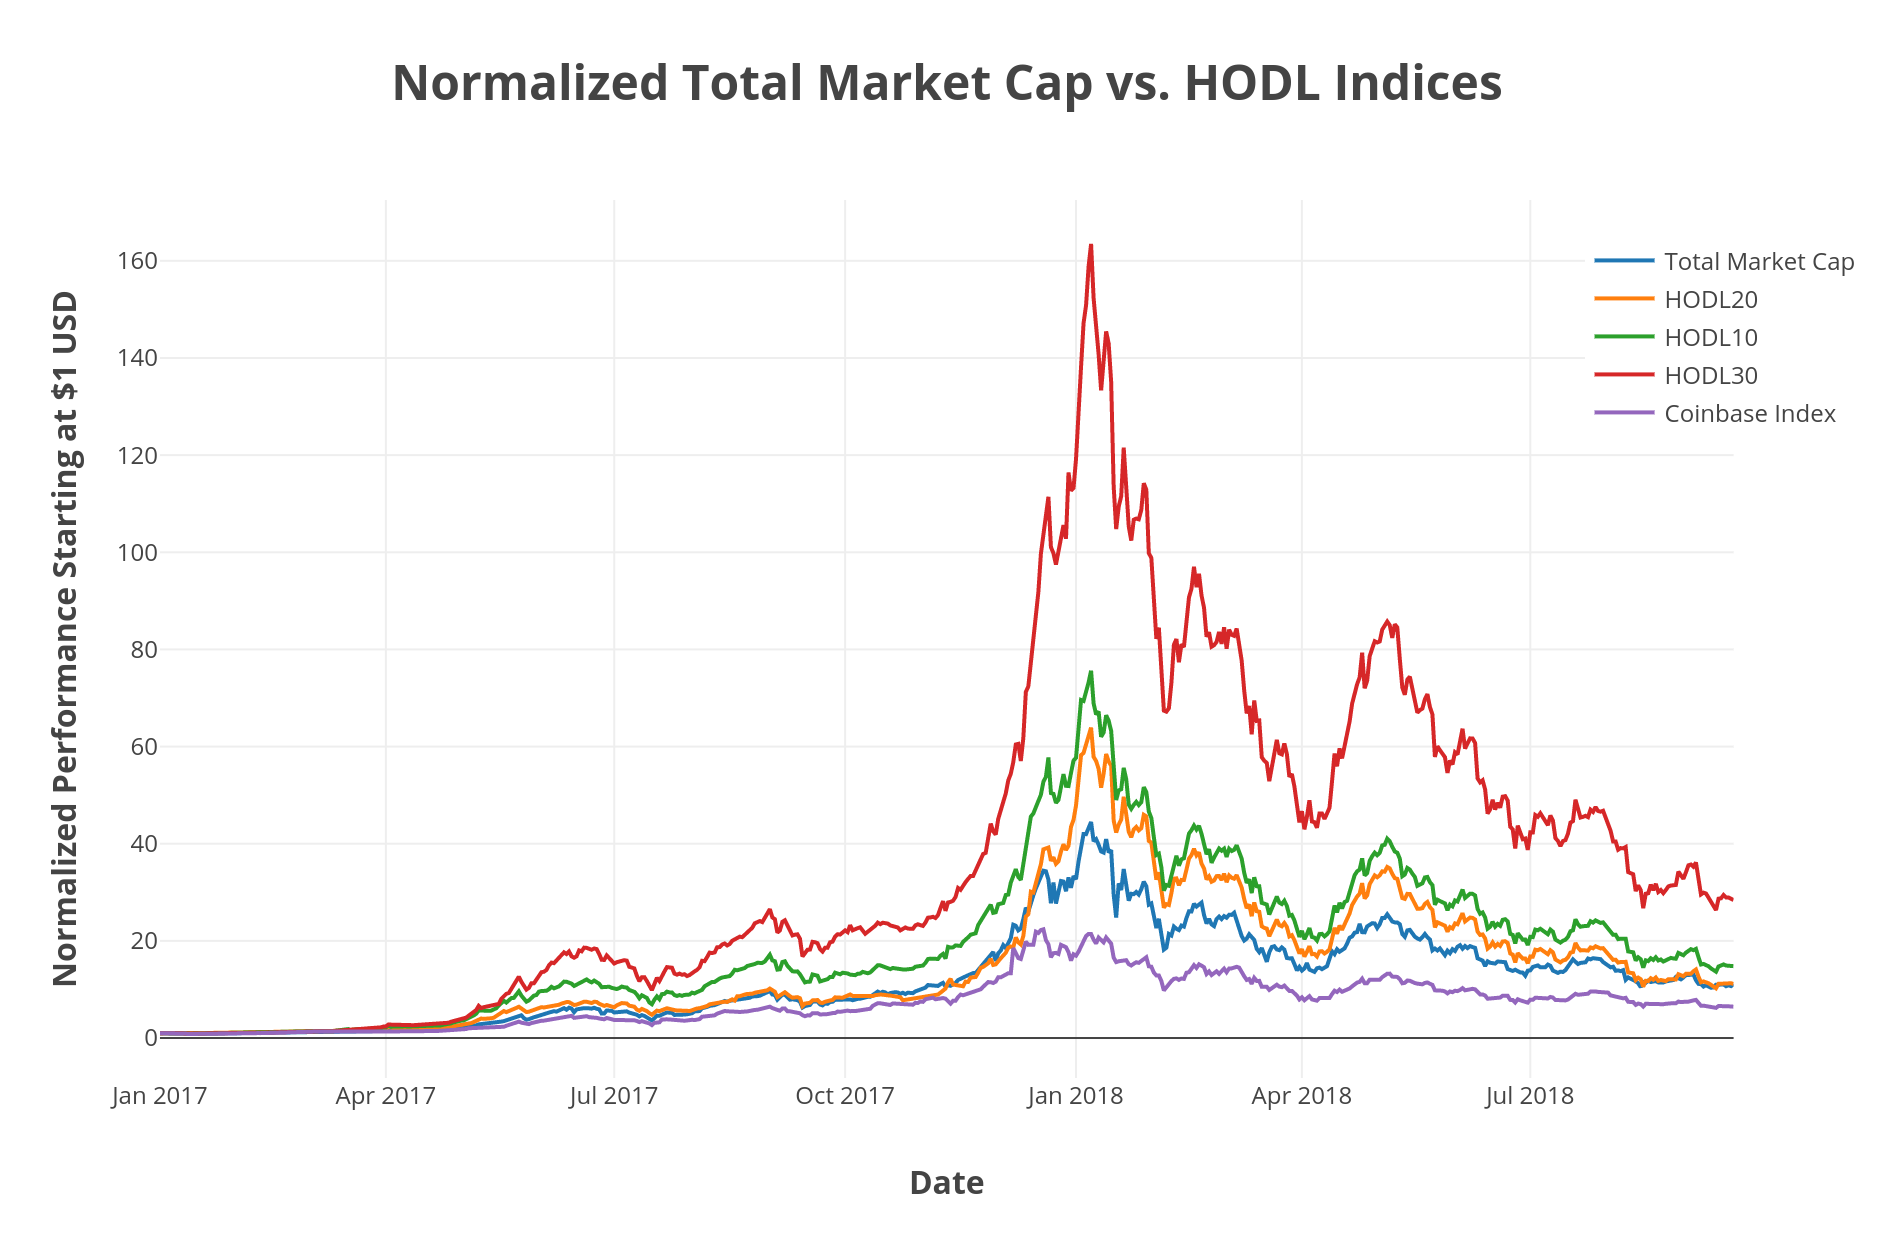
To quickly visualize how well the HODL indices track the market, we’re going to overlay the indices’ returns over the total cryptocurrency market cap graph.
To compare the data in way that makes sense, we’re going to normalize the starting point for total market cap as well as the indices at 1.
At a glance it looks like the returns from some of the top 30 coins end up outperforming the market. Continued multiplicative effects can cause some large discrepancies.
To see how tightly correlated the HODL indices are with the rest of the market, we’re going to compute the Pearson’s correlation coefficient as well.
Voila, it looks like both the HODL10 and HODL30 are tightly coupled with the overall market’s performance.
Available to All Investors
We’ve made these indices available to everyone on HodlBot. All you need to get started is a Binance, Bittrex, Kraken, or KuCoin account.
Our goal is to democratize investing for everyday people, so we’ve made our price point affordable with paid subscriptions starting at $3/month. It’s free to try for the first 7 days.
Creating these new indices was just the tip of the iceberg for us. We’re building a platform that can automate any trading strategy.

