Last year, I published an article which discovered that 75% of the top 200 coins by market cap had a correlation of 0.67 or higher over the last two years.
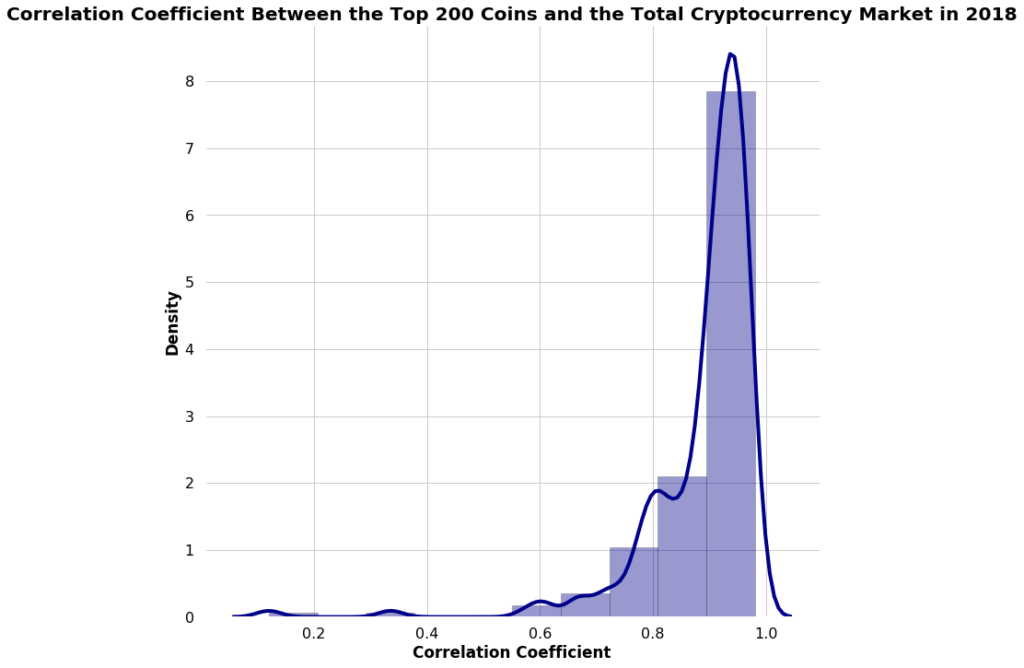
In 2018, correlations between cryptocurrencies and the total cryptocurrency market were especially high. 75% of the top 200 coins by market cap had a correlation of 0.87 or higher.
High correlations between individual coins are typically a really bad thing bcause it makes harder to mitigate risk by diversifying and it implies that the market cannot differentiate between good & bad projects.
But since then, the market has changed. So far 2019 has primarily been a sideways market.
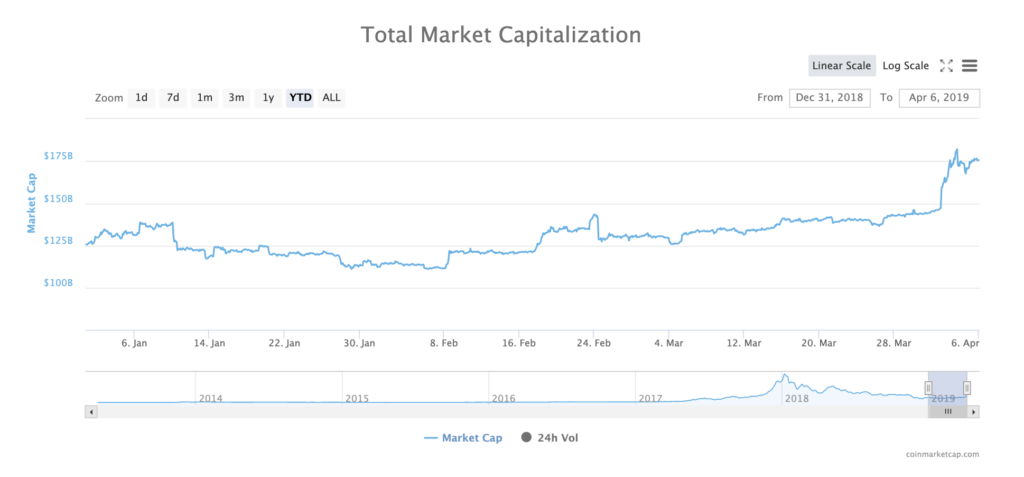
Given these developments, one might expect to see lower correlations in 2019.
So how have things changed in 2019? Let’s dig in.
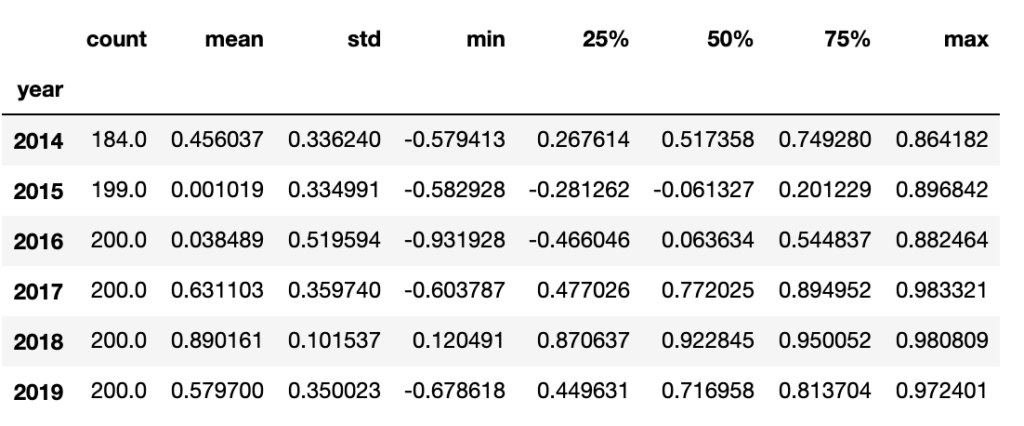
TLDR: From 2018 to 2019, the average correlation coefficient across the top 200 cryptocurrencies by market cap decreased from 0.89 to 0.58. We applied a one-tailed Welch’s T-test and found the decrease to be statistically significant.
Analysis Method
Before we go into the results, we’re going to quickly review the analytical method we’re using to quantify correlation.
How Correlated is Any Single Coin to the Rest of the Market?
In order to calculate how any single individual coin is correlated with the overall market, we’ll need two pieces of information:
- Price series data for the coin in question
- Total cryptocurrency market cap data for the entire market
The market cap of every single coin is already included in total cryptocurrency market cap data. Because we don’t want to double count, we need to make a slight tweak by subtracting the individual coin’s market cap from the total market cap.
Rest of the Market Cap = Total Market Cap — Individual Market cap
Once we’ve made this adjustment to our data, we can then calculate the Pearson correlation coefficient between the two over the entire time period.
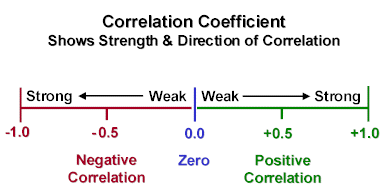
A correlation coefficient of +1 implies that the pair will always move in the same direction. Conversely, a correlation coefficient of -1 implies that the pair will always move in the opposite direction. If the correlation coefficient is 0, this suggests there is no observable linear relationship between the two.
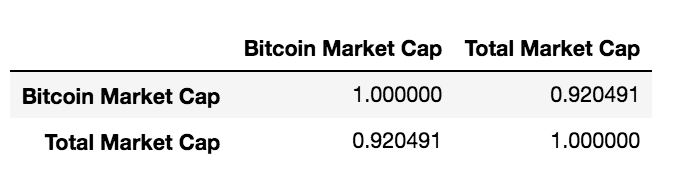
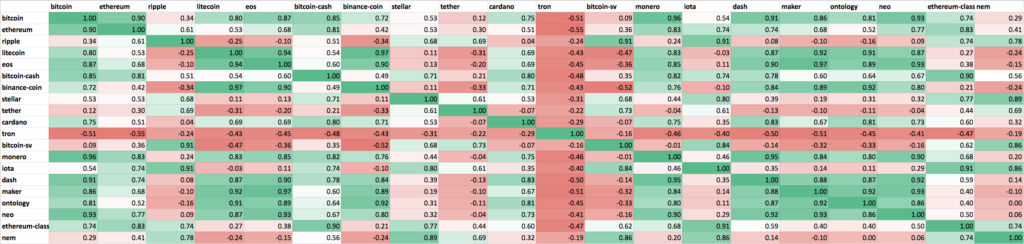
Here’s the correlation matrix between BTC & the overall market.
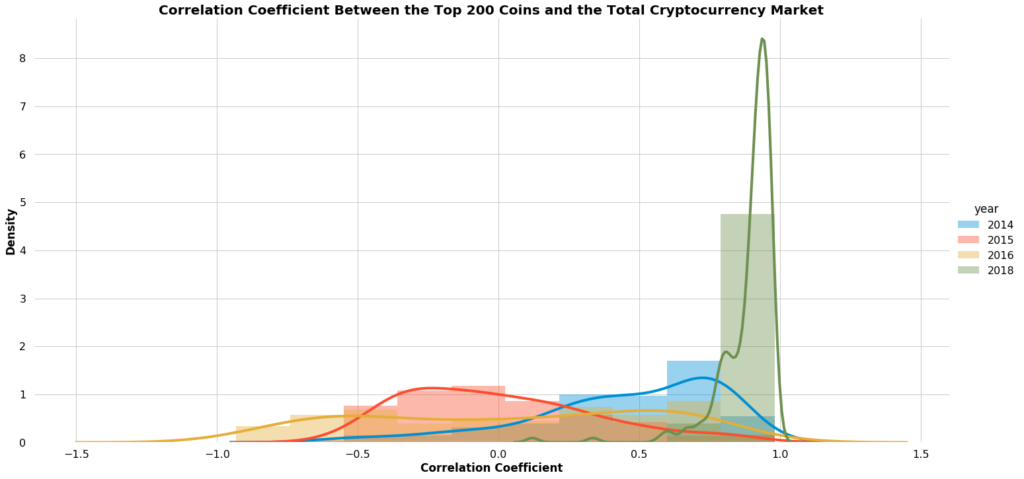
All we have to do is repeat this process for each of the top 200 coins. Then we can plot a histogram and density plot with all of the correlation coefficients.
A Blast to the Past
The cryptocurrency market was comparably much less uncorrelated back in 2014, 2015, and 2016. If we examine these years side-by-side, it’s very clear that the cryptocurrency market has become a lot more correlated in recent years.
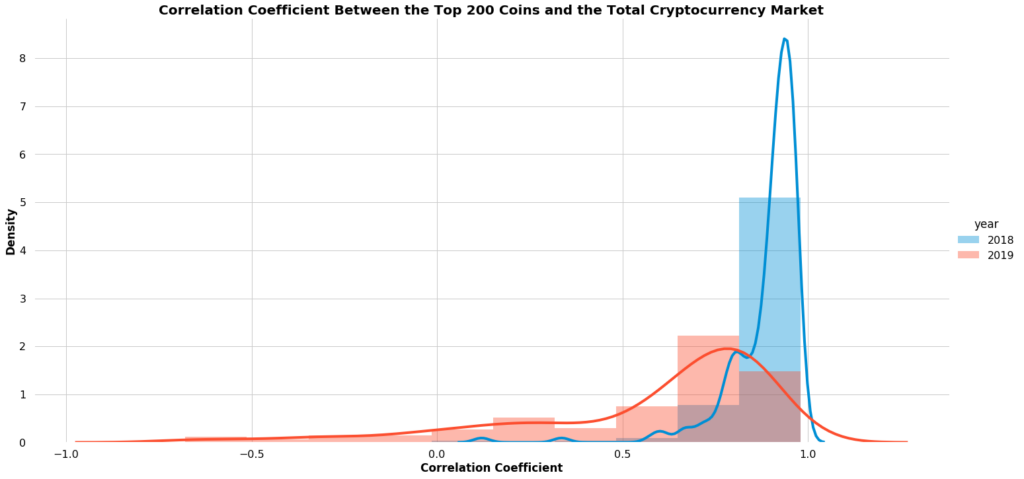
So How Have Things Changed in 2019?
At a glance, it looks like cryptocurrencies are less correlated in 2019 than in 2018.
The two distributions look very different. But how can we be sure that it is statistically significant?
Welch’s t-test is used to statistically test the difference between two sample means that have unknown, and unequal underlying variances.
A two-tailed test is used to evaluate whether two populations have equal means. In our particular case, we want to use a one-tailed test. We want to see whether cryptocurrency correlations in 2019 are lower than in 2018.
So here’s how we’re going to set up our hypotheses.
Null hypothesis: the mean cryptocurrency correlation coefficient in 2019 is higher or equal to the cryptocurrency correlation coefficient in 2018.
Alternate hypothesis: the mean cryptocurrency correlation coefficient in 2019 is lower than the cryptocurrency correlation coefficient in 2018.
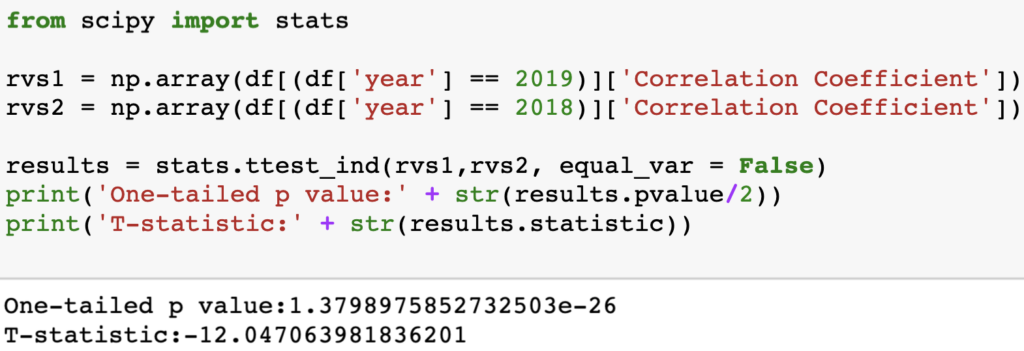
After running the test, we get a T-value statistic of -12.04 and a p-value that is much smaller than 0.01.
Therefore, we should reject the null hypothesis since we have a lot of evidence that suggests that the mean of correlation coefficients in 2019 is much lower than in 2018.
Is this Good News?
Yes. Diversification works better when correlations are low.
Harry Markowitz, the father of modern portfolio theory, postulated that the most important aspect of risk to consider is an asset’s contribution to the overall risk of the portfolio, rather than the risk of the asset in isolation.
Diversification is the only free lunch in finance — Harry Markowitz
This means that by including assets with a low or negative correlation in your portfolio, you can reduce the overall variance and therefore reduce the risk of your portfolio. Assets that are negatively correlated or uncorrelated tend to cancel each other out.
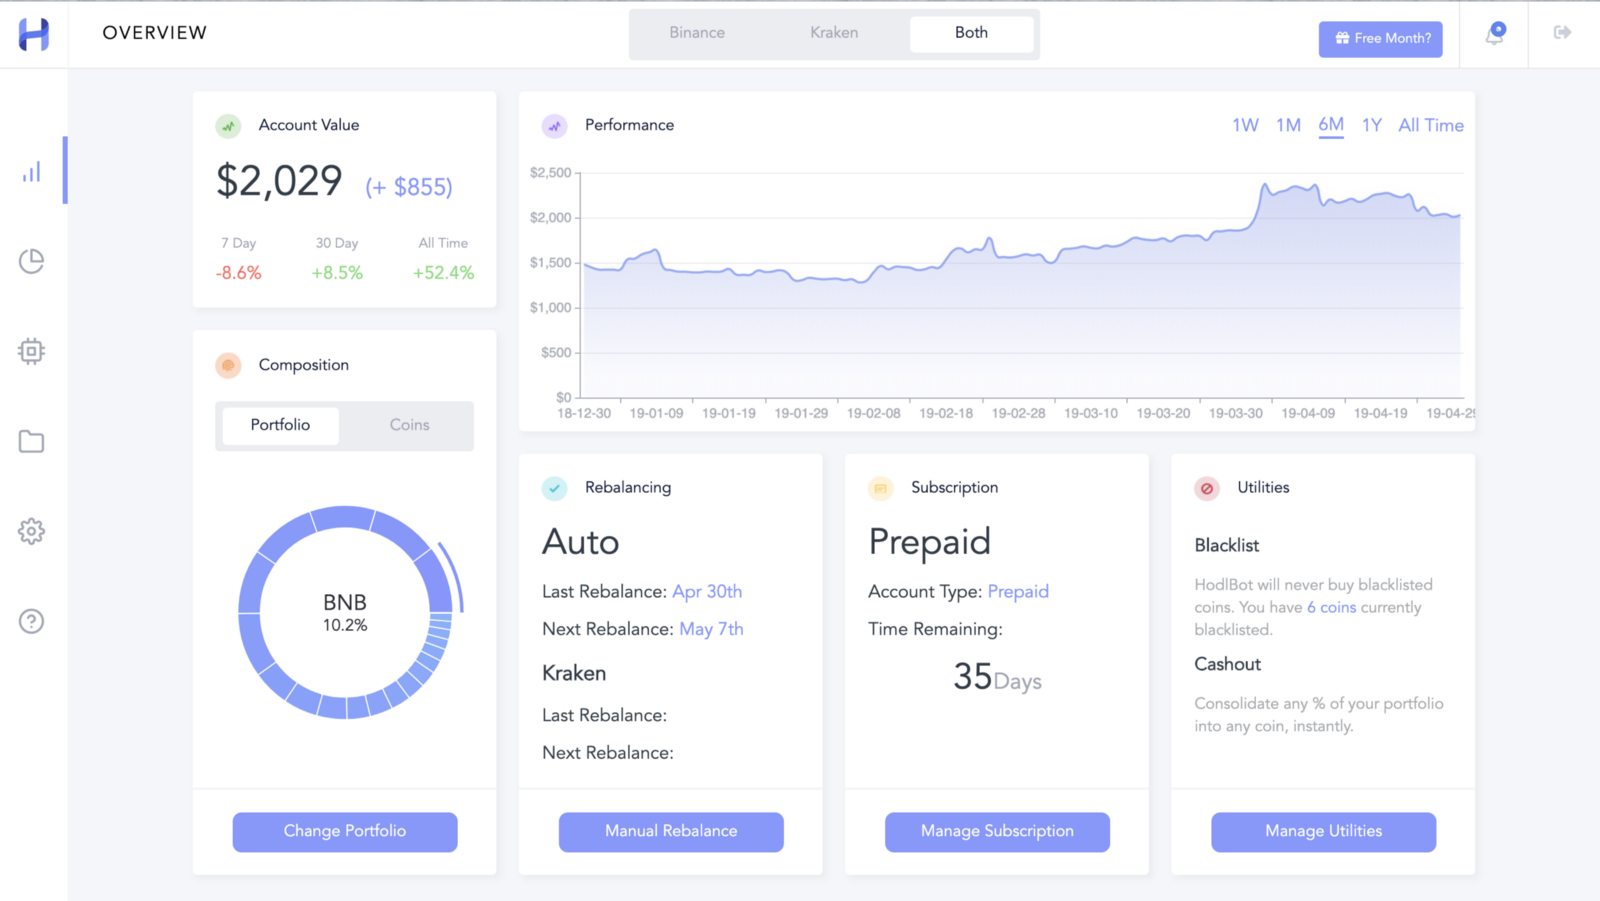
At HodlBot, we build cryptocurrency indices for everyday investors. An index where every single coin is correlated to another is not much a diversified portfolio. That’s why we are happy to see lower correlations between assets. It simply renders portfolio diversification much more effective.
Should I take this with a grain of salt?
Yes, correlations can change.
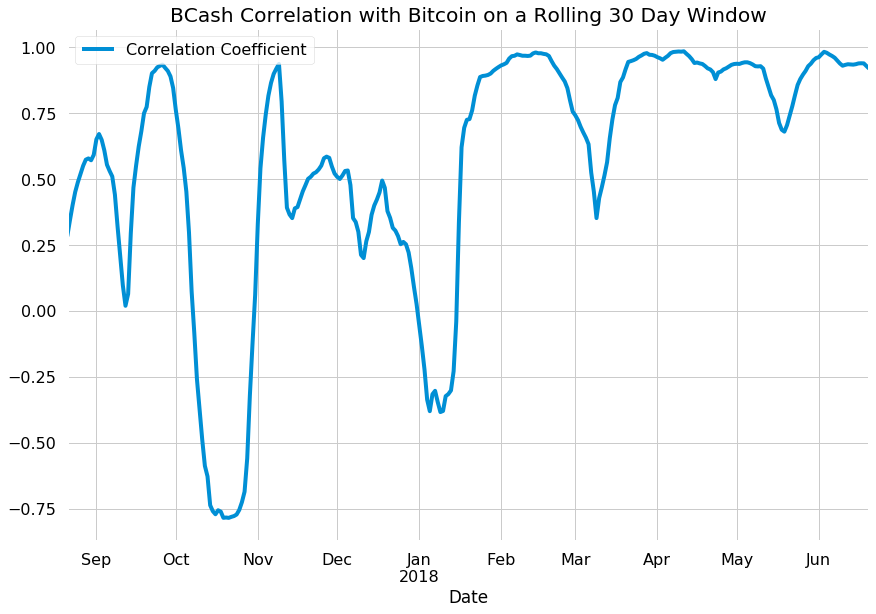
Correlation changes over time
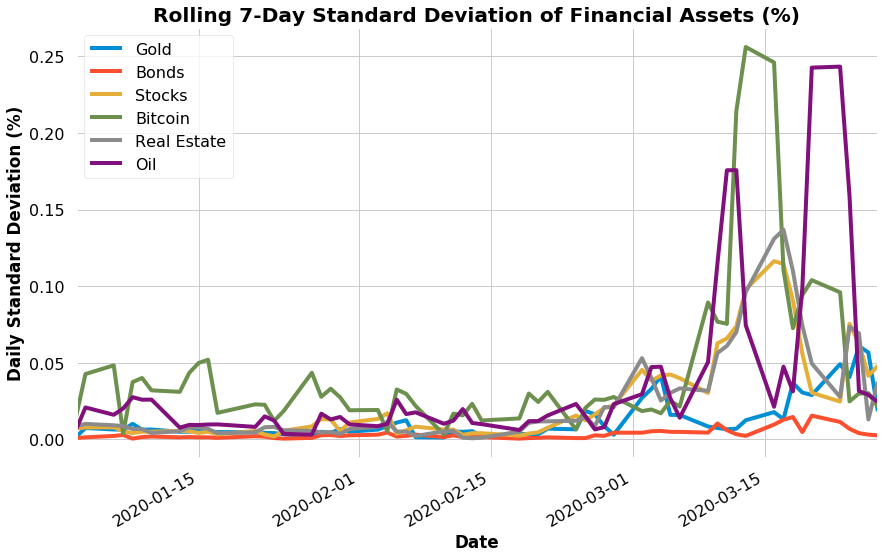
The correlation coefficient of a pair of assets changes wildly over time. Just because something was correlated a certain way in the past, does not mean the relationship will hold in the future. The 30-day rolling correlation for many coins looks like this, a series of ups and downs.
Pearson’s Correlation Coefficient Assumes a Linear Relationship
Linear relationships are easy to understand and easy to model. However, many relationships between two assets are non-linear. It can be polynomial, exponential, etc. In these cases, Pearson’s correlation coefficient unnecessarily simplifies the relationship.
The Dataset Used in This Analysis
I pulled cryptocurrency prices & global market cap data from Coinmarketcap.
On a year-per-year basis, I took a snapshot to find the top 200 ranked coins by market cap. I then computed their correlation coefficient based on the price-data for that year.